
India – Testing Strength Amidst Crisis
Executive Summary
A prolonged shock India can’t easily take in its stride
The West Asia crisis has now prolonged beyond initial expectations and beyond what India can comfortably absorb without macro and earnings consequences. With Brent crude rising sharply from
~$63/bbl in Dec-25 to ~$107/bbl by mid-May 2026, the risk has moved from a geopolitical tail event to a direct economic concern. India’s dependence on imported crude, exposure to the Strait of Hormuz, and sensitivity of inflation, CAD and fiscal deficit to oil prices mean that even a sustained risk premium, without an actual closure, can materially weaken our macro setup.
The impact is likely to be felt with a lag across corporate earnings, especially in crude-sensitive sectors such as cement, paints, tyres, aviation and OMCs. Cement and paints appear most vulnerable due to direct input-cost pressure and already weak margin starting points, while OMCs face under-recovery risk if retail fuel price hike remains limited. The government has responded through liquidity support, excise cuts, regulatory caps and conservation appeals, but these measures only soften the blow rather than remove the stress. Also rising inflationary pressures are starting to weigh on borrowing costs for corporates and a change in RBI MPC stance to a more hawkish one cannot be ruled out. Portfolio strategy, therefore, remains focused on limiting direct crude exposure, avoiding sectors where valuations do not reflect the risk, and staying invested in businesses with balance-sheet strength, pricing power and structural demand visibility.
The PM’s advisory asked citizens to shift to public transport and carpooling, prefer railways for goods movement, adopt EVs, revive WFH norms, avoid unnecessary overseas travel and foreign exchange outflows, defer gold purchases, prioritise Made-in-India goods, and reduce edible oil consumption. This is effectively a demand-side policy playbook for managing a supply-side crude shock and it signals that the government views the risk as sustained, not transient.
As of May 15, 2026, Brent is trading at ~$109 having risen sharply from the Dec-25 low of $63, with the Apr–May 2026 quarter averaging ~$103. This marks the fastest crude upcycle since Russia-Ukraine, and crude at these levels has historically been sufficient to trigger significant EBITDA margin compression across energy-linked sectors. The key question is no longer whether crude will rise it already has but how long it stays elevated and whether a Hormuz closure escalates it further.
Macro sensitivity – 3 transmission channels
| Metric | Impact per $10/bbl rise | Context & Caveat |
| CPI Inflation | +50–70bps | Direct fuel and LPG pass-through; second-round via transport, logistics, and food prices could push impact materially higher. Assumes full pass-through; under-recovery absorbs some if GoI intervenes. |
| Current Account Deficit | +$15bn (~0.35% of GDP) | Already elevated by gold and electronics imports. A $10/bbl rise compounds strain directly. At $110 Brent, CAD could breach 2.0% of GDP, historically a rupee stress zone. |
| Fiscal Deficit | +25bps of GDP | Via LPG/kerosene subsidies. Additionally, higher crude drives up fertiliser import costs, lifting the subsidy bill further. GoI has excise duty headroom (~Rs 8/litre) as a partial buffer. |
| Remittances & Exports | $100bn annualised at risk | Middle East accounts for 38% of India’s remittance inflows and 15% of goods exports (~60% of ME exports go to UAE alone). Prolonged conflict threatens this foreign exchange pillar. |
Source: Nuvama Institutional Research; Sowilo estimates. Macro sensitivity estimates assume full pass-through.
External Deficit: The Oil Shock Meets an Already-Strained CAD
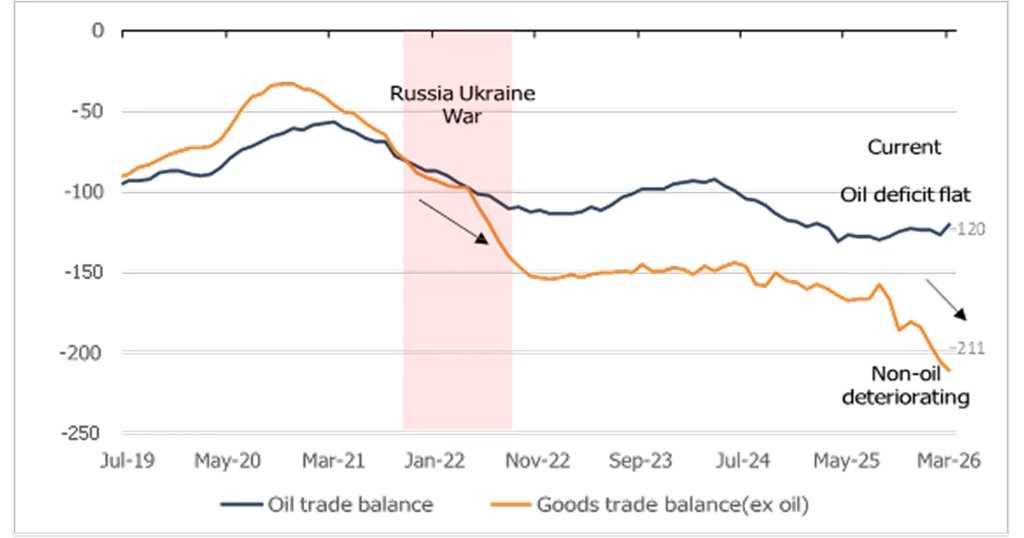
India’s external account is the most immediate transmission channel from crude to the macro. At $107/bbl, the oil import bill swells sharply: every $10/bbl rise widens the trade deficit by ~$15bn annually. But the chart below reveals a more nuanced picture: India’s oil trade deficit, while large, has been relatively stable at around -$120bn over the past two years. The more alarming deterioration is in the non-oil goods deficit, which has widened to
-$211bn, driven by gold, electronics, and capital goods imports. Rising crude therefore arrives not as the sole problem but as the aggravating factor on an already-strained external account, compressing the current account and putting incremental pressure on the rupee at a time when the cushion is thin.
Chart 1 · Rising crude compounds India’s external deficit – oil trade balance vs. current account
Source: Nuvama Institutional Research
Why this time is different vs. 2022 (Russia-Ukraine)
In 2022, the Russia-Ukraine war’s financial market impact lasted 3–4 months, with Indian equities correcting 15–20%. Recovery was swift because global economies were emerging from COVID-era pent-up demand, particularly in services. That structural tailwind is absent today. Furthermore, cyclical sectors (industrials, autos, real estate, consumer services) were just recovering in 2022 with valuations depressed. Today, many sit at cyclically peak margins with elevated multiples: Nifty trades at 19–20x 1-year forward earnings (~1 standard deviation above mean), with market cap-to-GDP at 133% against a 10-year average of ~100%. The macro risks are not priced in, and the bounce post any current shock is unlikely to be as swift.
Borrowing costs are turning higher
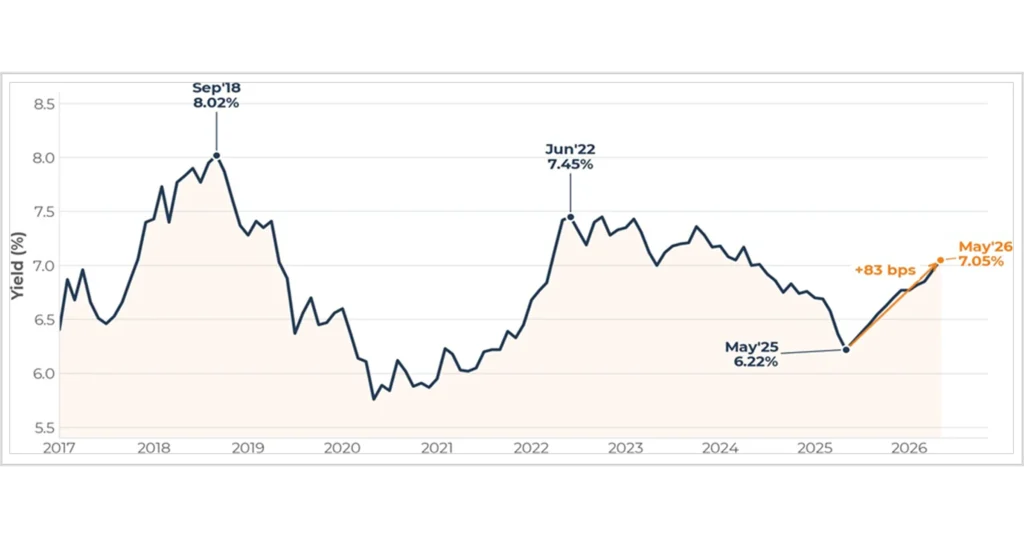
Yields have round-tripped the entire cut cycle. India’s 10Y G-Sec has moved from a cycle low of 6.22% in May ’25 to ~7.05% by mid-May ’26, a +83 bps reversal off the lows, and the largest 12-month rise since the 2022 tightening cycle. The driver mix is familiar: Brent holding near $106/bbl, a softer rupee, sticky imported inflation, and the RBI rolling its stance back from accommodative to neutral, which has effectively closed the door on near-term rate cuts.
Every prior spike has been a leading signal. The 2018 IL&FS / oil-shock episode (Sep ’18 peak at 8.02%) and the 2022 RBI-tightening leg (Jun ’22 peak at 7.45%) each preceded a tangible tightening in financial conditions. The current move is starting to look similar in shape, if not yet magnitude.
Chart 2 · India 10-Year G-Sec yield: 83 bps off the May ’25 trough
Source: RBI, Bloomberg, Trading Economics; monthly average yields (approx.).
Petrol and diesel are flowing straight into WPI
Fuel is twice as heavy in WPI as in CPI. Fuel & power carries a ~13% weight in WPI against ~7% in CPI, which is why the wholesale basket is far more sensitive to crude. That sensitivity is now in the print: WPI has snapped back to 8.3% YoY in Apr ’26 (vs 0.85% a year earlier) after spending most of 2025 in negative or low-single-digit territory, a far sharper inflection than CPI, still tracking ~3.5%.
WPI leads CPI by 2–3 quarters and the broader producer-price literature holds that wholesale cost pressures filter into retail prices with a lag, because manufacturers and traders need time to pass through input costs. A fuel-driven WPI shock today is therefore the early warning signal for the next leg of headline CPI, not a one-print curiosity.
Chart 3 · WPI vs CPI YoY: fuel-led April spike is the leading signal
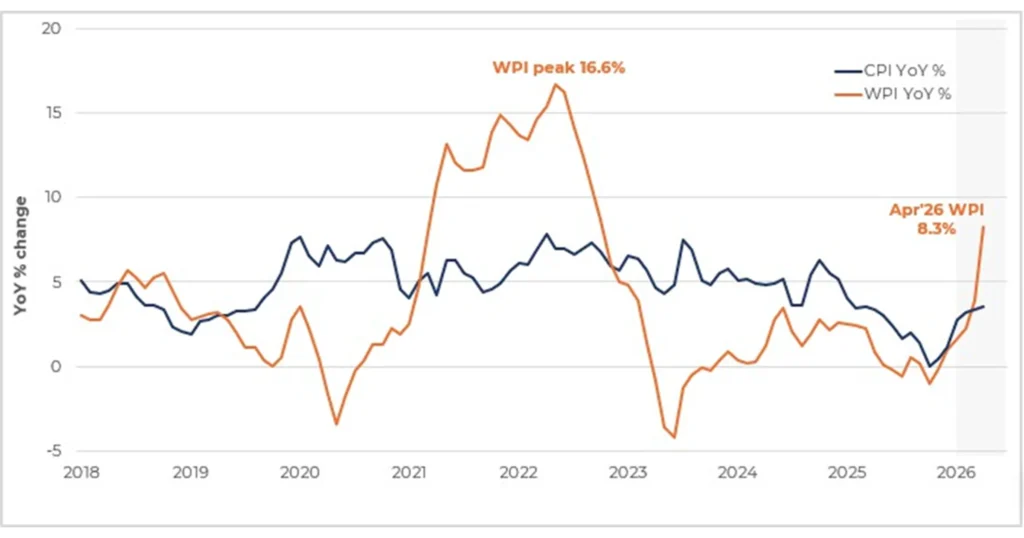
Source: MoSPI, Office of the Economic Adviser, GoI. Dashed segment = forecast / estimated print.
Corporates and NBFCs are flagging ~100 bps higher funding cost
The G-Sec curve anchors the entire credit complex. The yield move is now visible where it matters: in incremental borrowing costs. On a recent earnings call, one NBFC flagged a ~100 bps increase in incremental funding cost over the last 12 months, with NBFC bond spreads widening faster than the underlying G-Sec move. Banks have begun re-pricing MCLR and bulk deposits, and the marginal cost of funds on AA / AA– NBFC paper is now meaningfully above the level at which loan-book yields were originally underwritten.
NIM compression is the path of least resistance. If yields hold here, lenders with floating-cost / fixed-yield mismatches will see margin pressure first, and capex-heavy borrowers will face re-rated hurdle rates into FY27. The implication for positioning is straightforward: favour lenders with strong liability franchises and pricing power, lighten on rate-sensitive duration plays.
Bottom line
Yields, WPI and corporate funding costs are telling the same story. A fuel-led WPI spike, a 10Y back above 7%, and lenders/borrowers already absorbing 100 bps of incremental cost together imply that the next RBI move is more likely a hold-with-hawkish-tilt (or a hike) than the rate cut the market was pricing six months ago. Stay invested, but tilt the book toward businesses that benefit from, or are insulated against, higher cost of capital.
Sectoral impact of the lagged cost pass-through
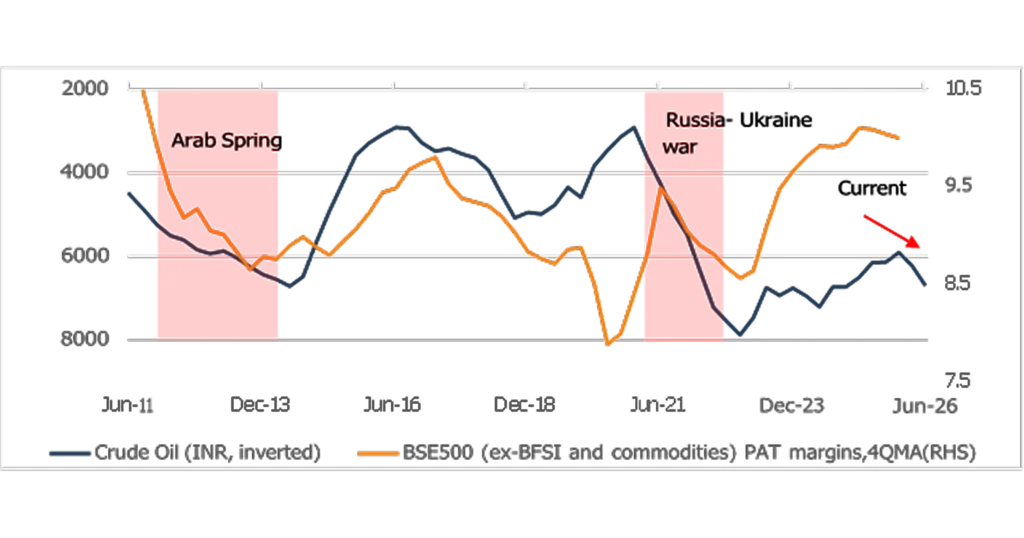
Crude oil does not impact corporate margins instantaneously. Input cost contracts, procurement cycles, and pricing lags mean that the full EBITDA impact of a crude spike is typically felt over a 1–2 quarter window following the price move. A critical contextual point: Brent has already crossed $100/bbl in the current quarter (Apr–May 2026 avg: ~$103; May 12 spot: ~$107), having risen sharply from the Dec-25 low of $63. The margin compression clock for cement, paints, and tyres has already started ticking. Q1FY27 results (reporting Jul–Aug 2026) will be the first full quarter to show the damage.
Chart 4 · Rising oil prices weigh on corporate margins
Source: Nuvama Institutional Research.
Note: Crude plotted on inverted axis line rising = crude falling, line falling = crude rising. Crude (INR, inverted) vs. BSE500 ex-BFSI PAT margins, 4QMA
The pattern across Arab Spring, Russia-Ukraine, and the present episode is consistent: crude spikes lead aggregate corporate margins lower with a 2–3 quarter lag. What makes the current episode different from the chart’s “Current” annotation is that Brent has moved faster than consensus expected: from $63 in Dec-25 to
$107 as this note goes to press. The sector-level chart below, built from quarterly EBITDA data across four crude-sensitive industries, establishes what the historical damage looked like and at what crude levels it was triggered. The uncomfortable read: for cement and paints, trough conditions in 2022 were hit at $97–98/bbl. We are already there.
| CEM EN T : M O ST VU L N E R AB LE5.3%Sector avg trough (Sep-22) vs. 25.6% pre-spike § ~20pp compression during 2022 crude cycle, worst of any sector§ Trough hit Sep-22 ($98/bbl), 1Q after the Jun-22 crude peak ($112): confirms lag§ Petcoke + diesel = ~30–35% of costs; petcoke contracts reprice with 1Q delay§ Current Mar-26: 14.6% at Brent $78, already as weak as Jun-22 when crude was $112§ Companies: UltraTech (ULTRACEMCO), Ambuja (AMBUJACEM), ACC (ACC) | T Y R E S : C R U D E M AT T ER S , S I G N A L I S D I FFU S E8.8%Sector avg trough (Jun-22) vs. 17.9% at low-crude peak § Statistical correlation is weak at all lags (r = -0.23, not significant); natural rubber (~40–50% of RM basket) is not crude-derived and dilutes the signal§ Extreme crude (>$100) is the clearest pain point: margins drop ~5.6pp from base; the current $107 crude falls squarely in this regime§ Jun-20 outlier (7.0% despite $33 crude) was demand collapse, not crude; confounders matter for this sector§ Current Dec-25: 15.4%; directional risk is real at current crude levels even if the lag is not precisely timed§ Companies: MRF (MRF), Apollo Tyres (APOLLOTYRE), CEAT (CEATLTD) |
| PA I N T S : S T R U CT U R A L + C YC LI CAL S Q U E EZE12.9%Sector avg trough (Sep-22) vs. 21.9% at low-crude peak § Impact is largely contemporaneous (Lag 0 strongest, r = – 0.37); petrochemical derivatives reprice in the same quarter crude moves§ Companies use pricing power to recover over 1–2 quarters after the initial hit, so the trough is often 1Q after the crude peak§ Sep-25 margin: 13.7% at Brent just $68, near 2022 trough on much cheaper crude; new entrants (Birla Opus) compressing margins structurally§ At $107 crude, this sector faces both structural and cyclical headwinds simultaneously§ Companies: Asian Paints (ASIANPAINT), Berger (BERGEPAINT), Kansai Nerolac (KANSAINER) | AVI AT I O N : FA ST I M PAC T, ST R O N G BU FFE R0.2%IndiGo trough (Sep-22) vs. 19.2% pre-crude-run § True lag is 0–1 quarter; ATF prices in India reset within 2–4 weeks of crude; cost hits P&L within the same quarter§ Earlier analysis suggested 3–4Q lag; this was a COVID artefact: low oil + destroyed demand created spurious positive correlation at longer lags§ Post-COVID clean data: Lag 0 corr = -0.53, Lag 1 = -0.41, fading quickly, confirming near-immediate pass-through§ Sep-25 dip to 3.1% was Pratt & Whitney engine groundings+ capacity mismatch, not crude (Brent was only $68 that quarter)§ Current Dec-25: 23.0%, the strongest margin buffer of the four sectors; but at $107 crude, pressure arrives within 1–2 quarters |
Chart 5 · Sector EBITDA margins vs. Brent crude (Jun-19 to Mar-26) Aviation, Cement, Paints, Tyres
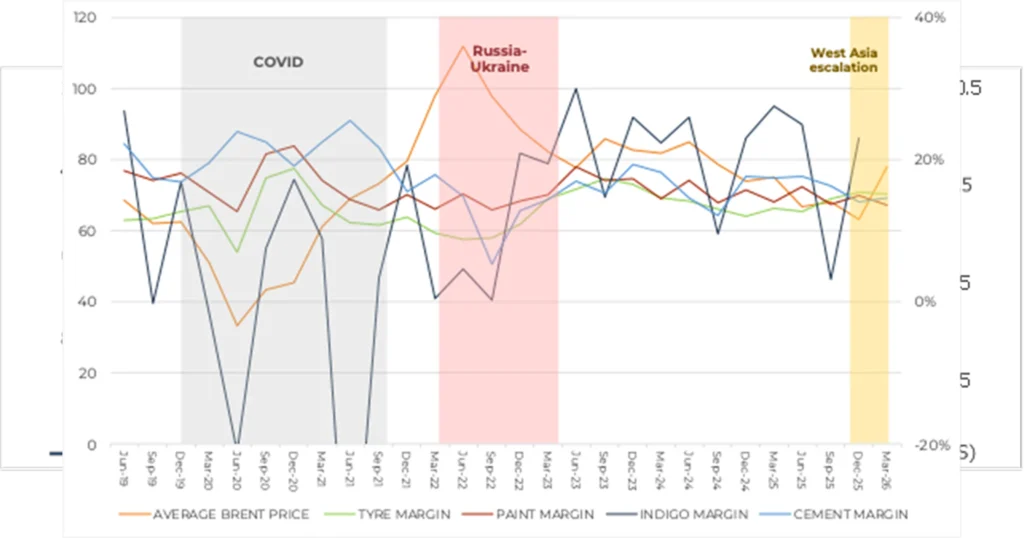
Source: Screener.in; EIA.gov; Sowilo estimates. IndiGo Jun-21 (−48.7%) off scale (COVID outlier); Y-axis clipped at −20% for readability.
What the Data Shows: Magnitude, Lag, and Where We Stand Now
| Sector | Crude peak | Pre-spike margin | Trough margin | Trough quarter | Compression | Lag | Current |
| Cement | $112 (Jun-22) | 25.6% (Jun-21) | 5.3% 𝗍 | Sep-22 ($97.7) | ~20pp | 1 quarter (r = -0.74) | 14.6% (Mar-26)↓ |
| Tyres | $112 (Jun-22) | 17.9% (Dec-20) | 8.8% 𝗍 | Jun-22 ($112) | ~10pp | Diffuse, no clean lag* | 15.4% (Dec-25) ↓ |
| Paints | $112 (Jun-22) | 21.9% (Dec-20) | 12.9% 𝗍 | Sep-22 ($97.7) | ~9pp | Contemporaneous (Lag 0 strongest) | 14.9% (Dec-25);13.7% (Sep-25)⚠ |
| Aviation (IndiGo) | $98 (Mar-22) | 19.2% (Dec-21) | 0.2% 𝗍 | Sep-22 ($97.7) | ~19pp | 0–1 quarter (ATF resets within weeks) | 27.6% (Dec-25)✓ |
Source: Screener.in; BSE filings; EIA; Sowilo analysis. Cement = UltraTech + Ambuja + ACC avg. Tyres = MRF + Apollo + CEAT avg. Paints = Asian Paints + Berger + Kansai avg. * Tyre crude correlation is statistically weak at all lags (r = -0.23, p = 0.24) natural rubber (~40–50% of RM) dilutes the pure crude signal; extreme crude (>$100) is the clearest pain trigger. IndiGo 0–1Q lag confirmed post-COVID: ATF resets in 2–4 weeks; earlier 3–4Q reading was a COVID statistical artefact (low oil + zero demand created spurious positive correlation). IndiGo Sep-25 (3.1%) was P&W engine groundings, not crude. ⚠ Paints Sep-25 margin of 13.7% at Brent $68 structural deterioration from competitive pressure compounding the cyclical crude risk.
Four findings stand out from the data. First, cement is the sector with both the strongest statistical signal (r = – 0.74 at 1-quarter lag) and the most pronounced margin compression (a 20% swing), and its current 14.6% (Mar-26, Brent avg $78) is already as weak as Jun-22 when crude was at $112. At $107 crude today, the Sep-22 trough conditions are the relevant comparison. Second, paints absorb crude contemporaneously (Lag 0 strongest) but is already near trough levels at only $68 crude in Sep-25; structural margin erosion from new competition means the starting point is weaker this cycle. Third, tyres show a diffuse rather than precise correlation (natural rubber dilutes the crude signal), but extreme crude (>$100) has historically produced a -5.6pp regime shift, which is exactly where we are today. Fourth, aviation’s pass-through is faster than previously assumed, 0–1 quarter, not 3–4, because ATF resets within weeks of crude; the longer lag in full-sample data was a COVID statistical artefact. With IndiGo’s buffer currently strong at 23%, the pressure builds but it starts from a higher base than the other sectors.
Sector matrix winners, losers, and the in-between
| Direct Losers | Indirect Losers | Largely Neutral | Benef iciaries |
| Aviation | Banks & NBFCs | IT Services | Oil & Gas (upstream) |
| Cement | (liquidity tightening, risk-off sentiment, credit cost uptickif growth slows) | Pharmaceuticals | Non-ferrous metals |
| Paints | (limited crude input exposure; USD revenue partially offsets) | Energy | |
| Autos & Ancillary | (ONGC, Oil India realisations rise with crude) | ||
| Chemicals | |||
| FMCG | |||
| Tiles & Durables |
Source: Nuvama Institutional Research; Sowilo classification.
OMCs – battling the under-recovery crisis
While much of the sectoral focus falls on crude consumers, the most acute near-term financial stress in the listed universe sits with India’s Oil Marketing Companies (IOCL, BPCL, and HPCL) caught between a price-frozen domestic retail regime and a $107/bbl import cost.
Space Intentionally left blank
| Factor | Detail | Impact on OMCs |
| Retail price freeze | Petrol and diesel prices unchanged despite Brent rising from ~$70 to $107/bbl | ~₹30,000 Cr/month aggregate under-recovery (IOCL + BPCL + HPCL) |
| Refinery margin cap ($15/bbl) | Excess refinery margins above $15/bbl converted to OMC discount, partially offsetting marketing losses | Relief up to ~₹60/litre discount on refined product; does not fully close the gap at current crude |
| ATF 25% monthly cap | Monthly ATF price hikes limited to 25%; airlines get partial pass-through; OMCs absorb the rest | OMCs bear the ATF margin shortfall above the permitted increase ceiling |
| Excise duty cut (₹10/litre) | March 2026 excise reduction passes savings to retail consumer, widens GoI’s fiscal gap but does not help OMC marketing margins | Neutral to marginally negative for OMC net realisation; burden shifts to government balance sheet |
Source: Sowilo estimates; Ministry of Petroleum and Natural Gas; SBI Research.
The mitigation-vs-stress calculus for OMCs depends on duration. At $107 crude sustained for one quarter, the under-recovery burden is manageable with a government compensation package (as was done in FY23). At
$110+ for two quarters or more without compensation, the balance sheet damage becomes material; all three OMCs have elevated debt levels post the capex cycle. Watch for any government announcement on OMC compensation or a retail price revision as the primary relief signal. Any retail price hike, even a partial one, would be a significant positive re-rating event for the sector.
Petrol and diesel retail prices were hiked by ₹3/litre, the first retail price revision in over two years. While this provides some relief to OMC marketing margins, it is only partial: at current crude levels, OMCs are estimated to still be losing ₹10–15/litre on petrol and diesel even after this hike, suggesting this is the first in a series of staggered increases rather than a one-time correction.
Incrementally, the move is positive for OMCs; it signals government willingness to pass through crude costs rather than absorb them entirely on the fiscal balance sheet. The direction of travel is clear: input cost inflation is beginning to flow through the chain, and earnings across aviation and CGD will need to be revised as the June price actions crystallise.6. Our portfolio positioning & Strategy
Portfolio Crude Sensitivity At a Glance
Only 6.8% of the portfolio sits in direct/high crude exposure sectors. The bulk, 75.2%, is in indirect/medium exposure sectors where crude impact is felt through demand softness rather than direct input cost linkage. The remaining 18% is in low/defensive segments largely insulated from the crude cycle.
| D I R E C T / H I G H EXPO S U R E | I N D I R E C T / M E D I U M EXP O S U R E | L OW / DE F E N S I VE |
| 6.8% | 75.2% | 18.0% |
| Materials & Chemicals · Energy | Industrials · Financials · Cons. Disc. | Healthcare · IT · Utilities · Comm. Svc. |
The portfolio’s crude sensitivity profile is a product of deliberate construction rather than accident. Our largest active bets Industrials and Financials are not crude-immune, but their exposure is indirect: demand-led rather than cost-led. We believe the quality businesses within these sectors can navigate a 1–2 quarter earnings headwind and emerge with competitive positioning intact. The sectors we are explicitly avoiding or have trimmed paints, cement, pure-play chemicals are precisely where the data shows the most direct and historically largest margin compression at current crude levels, and where valuations do not yet reflect this risk adequately.
Government response a multi-lever playbook
The government’s response to the West Asia shock has been rapid and multi-pronged, spanning credit support, fiscal relief, regulatory intervention, and direct citizen-level conservation appeals. The playbook draws on institutional memory from both the 2022 Russia-Ukraine episode and the COVID ECLGS experience.
A. ECLGS 5.0 liquidity bridge for MSMEs and aviation
The COVID-19 shock of 2020 offers the clearest precedent for how India can deploy a liquidity bridge to prevent an economic supply shock from becoming a solvency crisis in the MSME sector. The Emergency Credit Line Guarantee Scheme (ECLGS 1.0–4.0) was that bridge, and the data on its impact is compelling.
| ₹3.7L Cr | 11.0% → 3.3% | ₹1.8L Cr | 1.5 Cr |
| GUARANTEES ISSUED ECLGS 1.0–4 .0 | MSME GNPAMar’ 20 → Sep’ 25 | LOANS SAVEDf rom NPA slippage | MSME WORKERSjobs protected |
At least 13.5 lakh MSME accounts (93.7% in the Micro and Small category) were saved from NPA classification because of ECLGS, representing approximately 14% of the outstanding MSME credit book. The scheme was not merely credit forbearance; it demonstrably improved the balance sheet health of participating MSMEs.
ECLGS 5.0 the West Asia response (announced 5 May 2026)
In direct response to the West Asia conflict, the Union Cabinet has approved ECLGS 5.0, targeting MSMEs (working capital stress from higher freight and input costs) and aviation (ATF cost shock).
On aviation specifically: outstanding bank credit stands at ₹526 billion as of March 2026 (14% yoy growth). The
₹5,000 crore ECLGS 5.0 allocation represents ~9.5% of this outstanding, providing meaningful liquidity relief for carriers facing ATF price hikes of 35–52% across metro cities. MSME credit grew ~27% in FY26 and accounts for 18.5% of total bank credit; the health of this cohort is macro-critical.
The COVID analogy has limits: that crisis was a demand shock that reversed sharply; the current conflict is a supply shock with potentially stickier effects. But the government’s institutional muscle memory in deploying ECLGS-style interventions quickly is a genuine stabiliser.
| Parameter | MSME | Aviation |
| Guarantee cover | 100% | 90% |
| Credit quantum | Up to 20% of peak WC (Q4FY26), capped at ₹100 Cr | Up to 100% of peak WC (Q4FY26), capped at₹1,500 Cr per borrower |
| Total allocation | ~₹2.55 lakh crore | ₹5,000 crore |
| Loan tenure | As per scheme | 7 years (incl. 2-year moratorium) |
| Eligible accounts | ~1.1 crore (~45% of MSME portfolio) | Standard accounts with existing WC limits |
Source: SBI Research Ecowrap, Issue No. 05 FY27 (6 May 2026); PIB
B. Fiscal measures excise duty cut and royalty relief
| Measure | Detail | Fiscal Impact |
| Excise duty cut | ₹10/litre reduction on petrol and diesel, implemented late March 2026 to cushion retail prices from the crude spike | ~₹14,000 Cr monthly revenue loss to GoI |
| Royalty reduction on crude | Notified May 8, 2026: onshore crude royalty reduced to 10% (from 12.5%), offshore to 8% (from 10%), incentivising domestic production to reduce import dependence | Positive for ONGC, Oil India; reduces GoI’s royalty revenue but gains in domestic output over medium term |
C. Regulatory interventions capping refinery margins and ATF prices
| Intervention | Mechanism | Effect |
| Refinery margin cap | Refinery margins capped at $15/bbl; excess earnings above this threshold treated as a discount to state-run OMCs, effectively cross-subsidising their marketing losses | Partial relief for IOCL, BPCL, HPCL but does not fully offset under-recoveries at $107 crude |
| ATF price increase cap | Monthly ATF price hikes capped at 25%, limiting pass-through to airlines but forcing OMCs to absorb the residual cost surge from crude | OMCs absorb ATF margin deficit above the 25% pass-through ceiling |
D. PM’s direct appeal 11 May 2026
PM Modi’s May 11 advisory addressed citizens directly, urging reduction in petrol and diesel usage via public transport and carpooling, preference for railways over road freight, adoption of EVs, revival of WFH norms, avoidance of unnecessary foreign travel and forex outflows, deferral of gold purchases, prioritisation of Made-in-India goods, and reduction of edible oil consumption. This demand-side intervention is unprecedented in its specificity and signals that the government views the shock as sustained rather than transient
Investment Philosophy in This Environment
Our approach through this conflict is anchored in two principles. First, we focus on companies where the risk-reward is demonstrably favourable: businesses with strong balance sheets, pricing power, or structural demand tailwinds that crude cannot easily disrupt. Second, we are not adding to positions where valuations are pricing in perfection. This means we are running lower-than-normal exposure to direct crude losers and concentrating our active risk in sectors where the crude sensitivity is indirect, manageable, or where valuations already reflect a degree of pessimism.
Regards, Team Sowilo
Disclaimer: Any information contained in this material shall not be deemed to constitute an advice, an offer to sell/purchase or as an invitation or solicitation to do for security of any entity and further Sowilo Investment Managers LLP and its employees/directors shall not be liable for any loss, damage, liability whatsoever for any direct or indirect loss arising from the use of this information. Sowilo Investment Managers LLP SEBI Registered Portfolio Manager Company (INPO00008127).